Dashboard
SigmaShake provides two dashboard experiences:
- Local Dashboard (
ssg serve) — A developer-facing real-time governance UI running on your machine - Fleet Dashboard (Enterprise) — A cloud-hosted control plane for managing agents, policies, and SSO across your organization
Local Dashboard
The local dashboard is a real-time governance UI served at http://localhost:5599.
Starting the dashboard
ssg serve
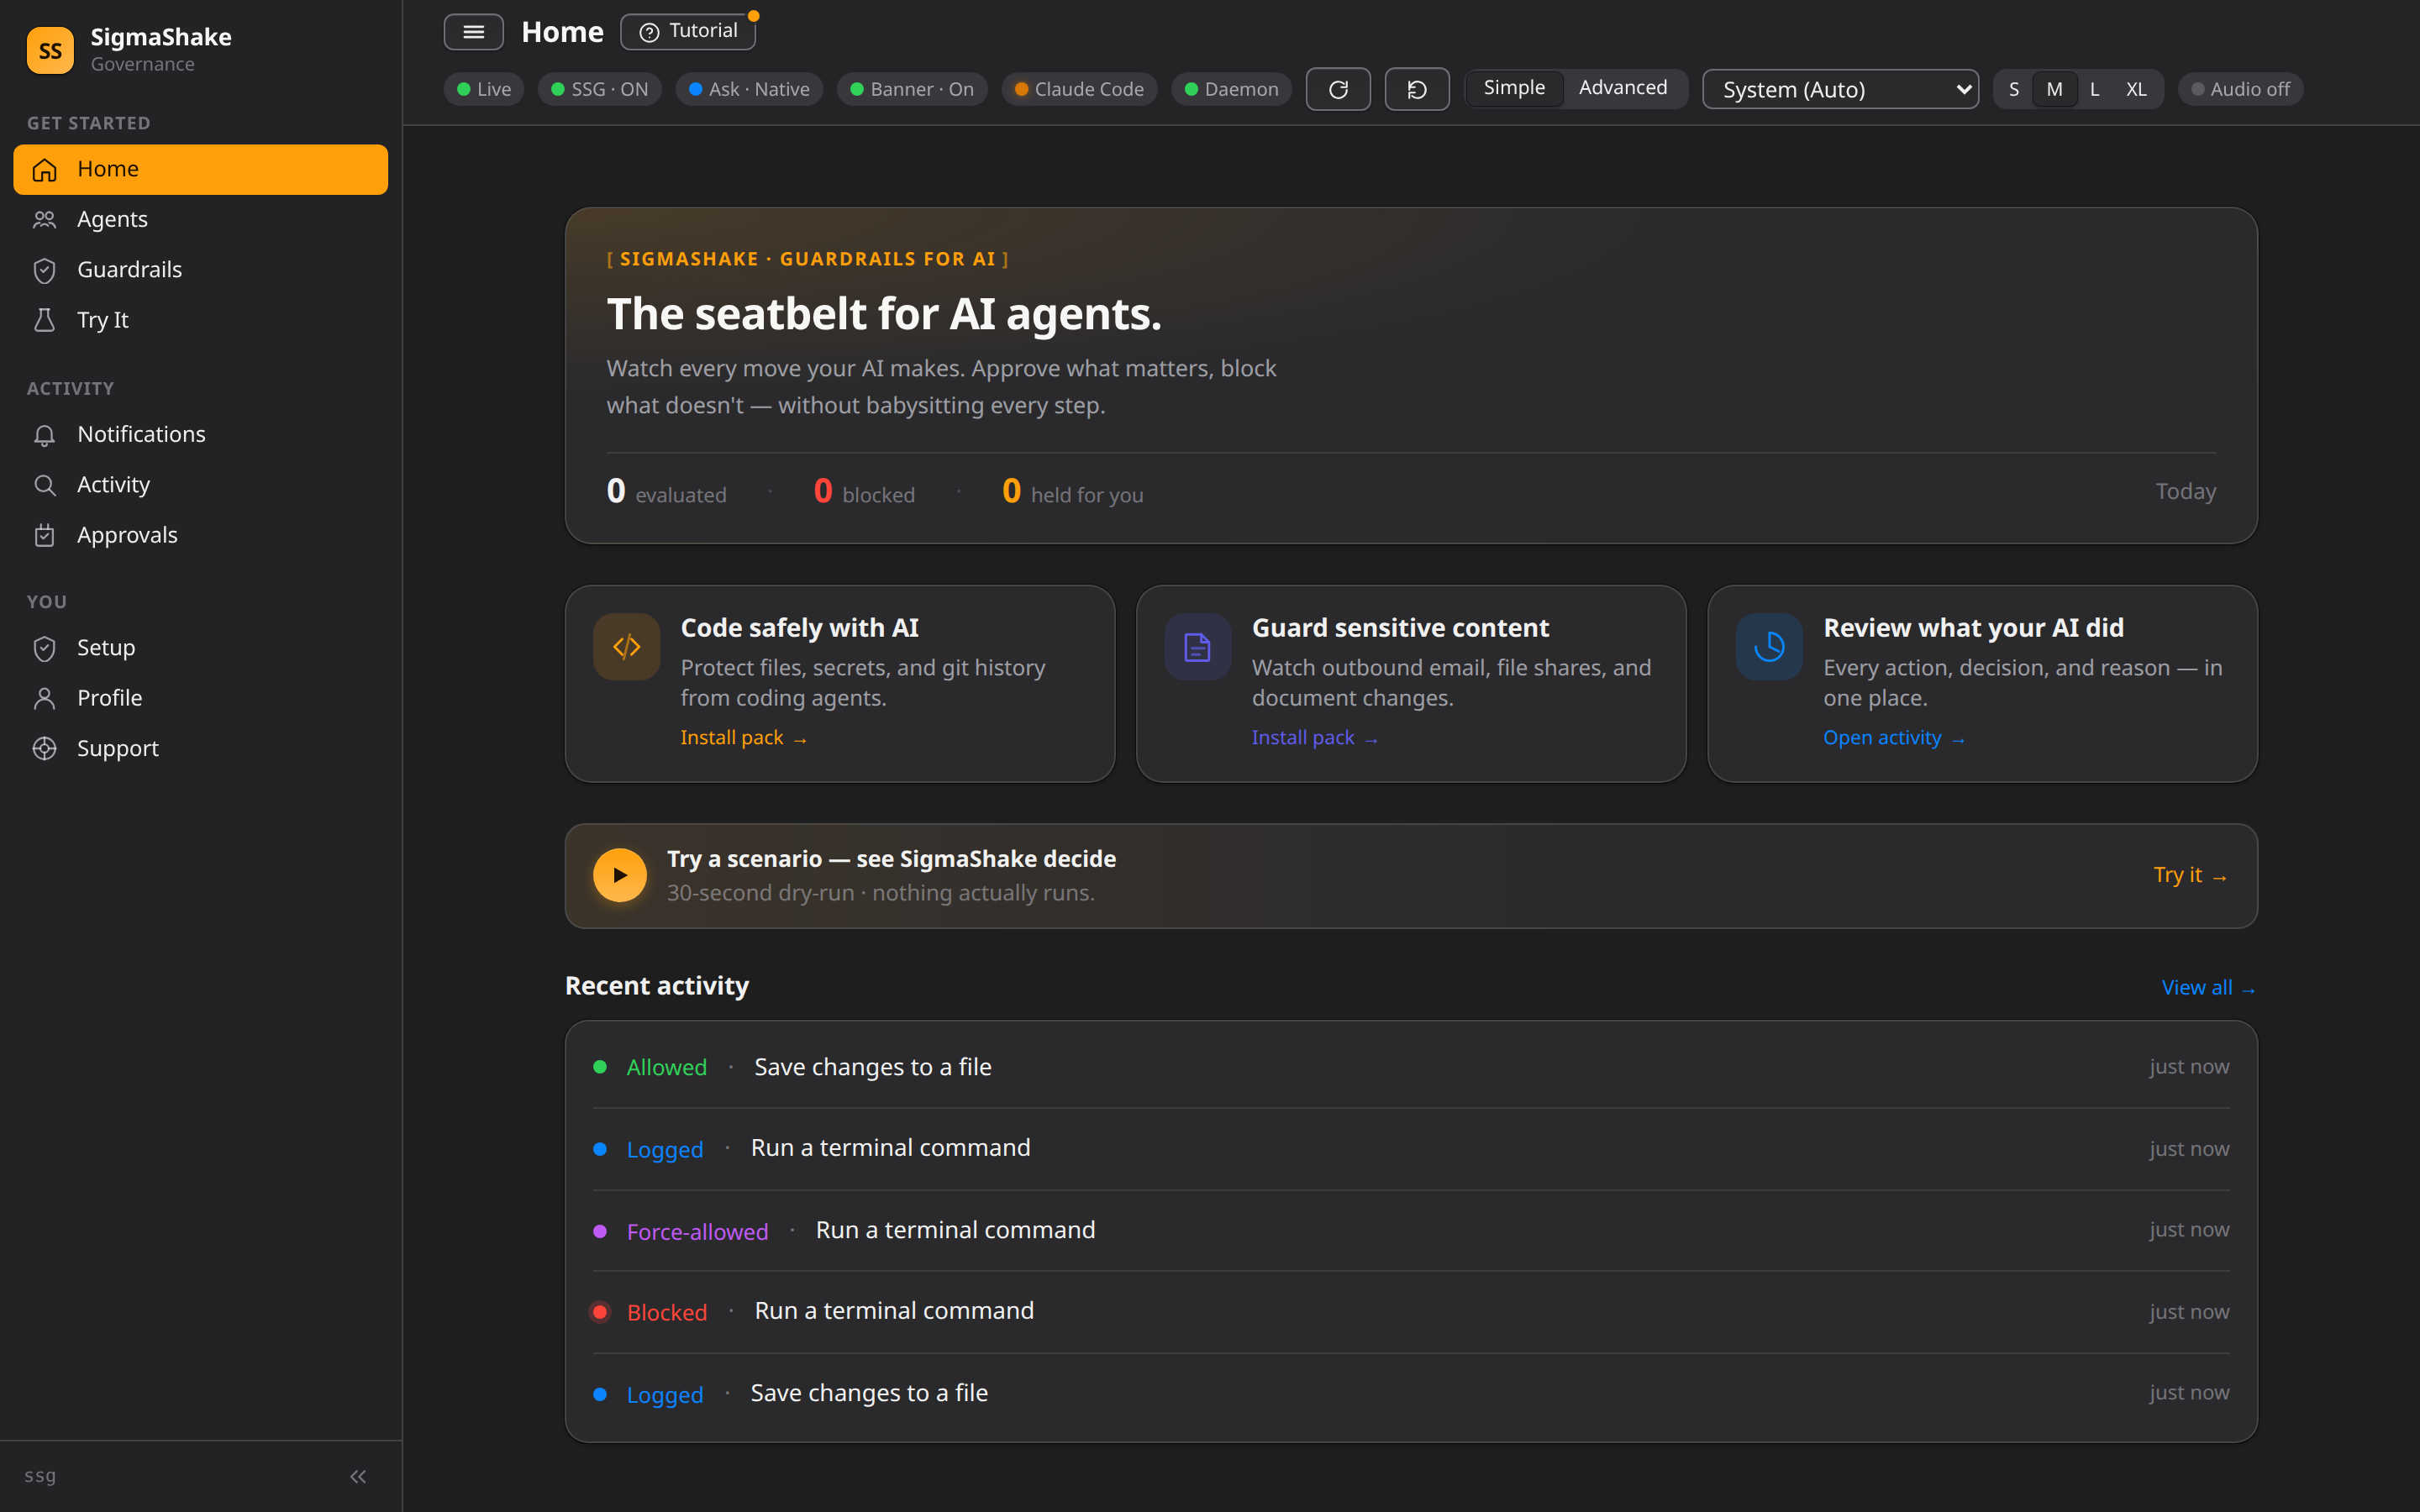
The dashboard opens at http://localhost:5599 — a real-time view of every tool call your AI agents make, what was allowed or blocked, and anything held for your review:
Pages
Home (/)
The main dashboard shows:
- Stats cards — Total evaluations, blocked, forced, asked
- Pending approvals — ASK decisions waiting for human review
- Blocked actions — Recent denied tool calls
- Audit log — Latest evaluations with decision, rule, tool, and timestamp
All sections update in real-time via Server-Sent Events (SSE).
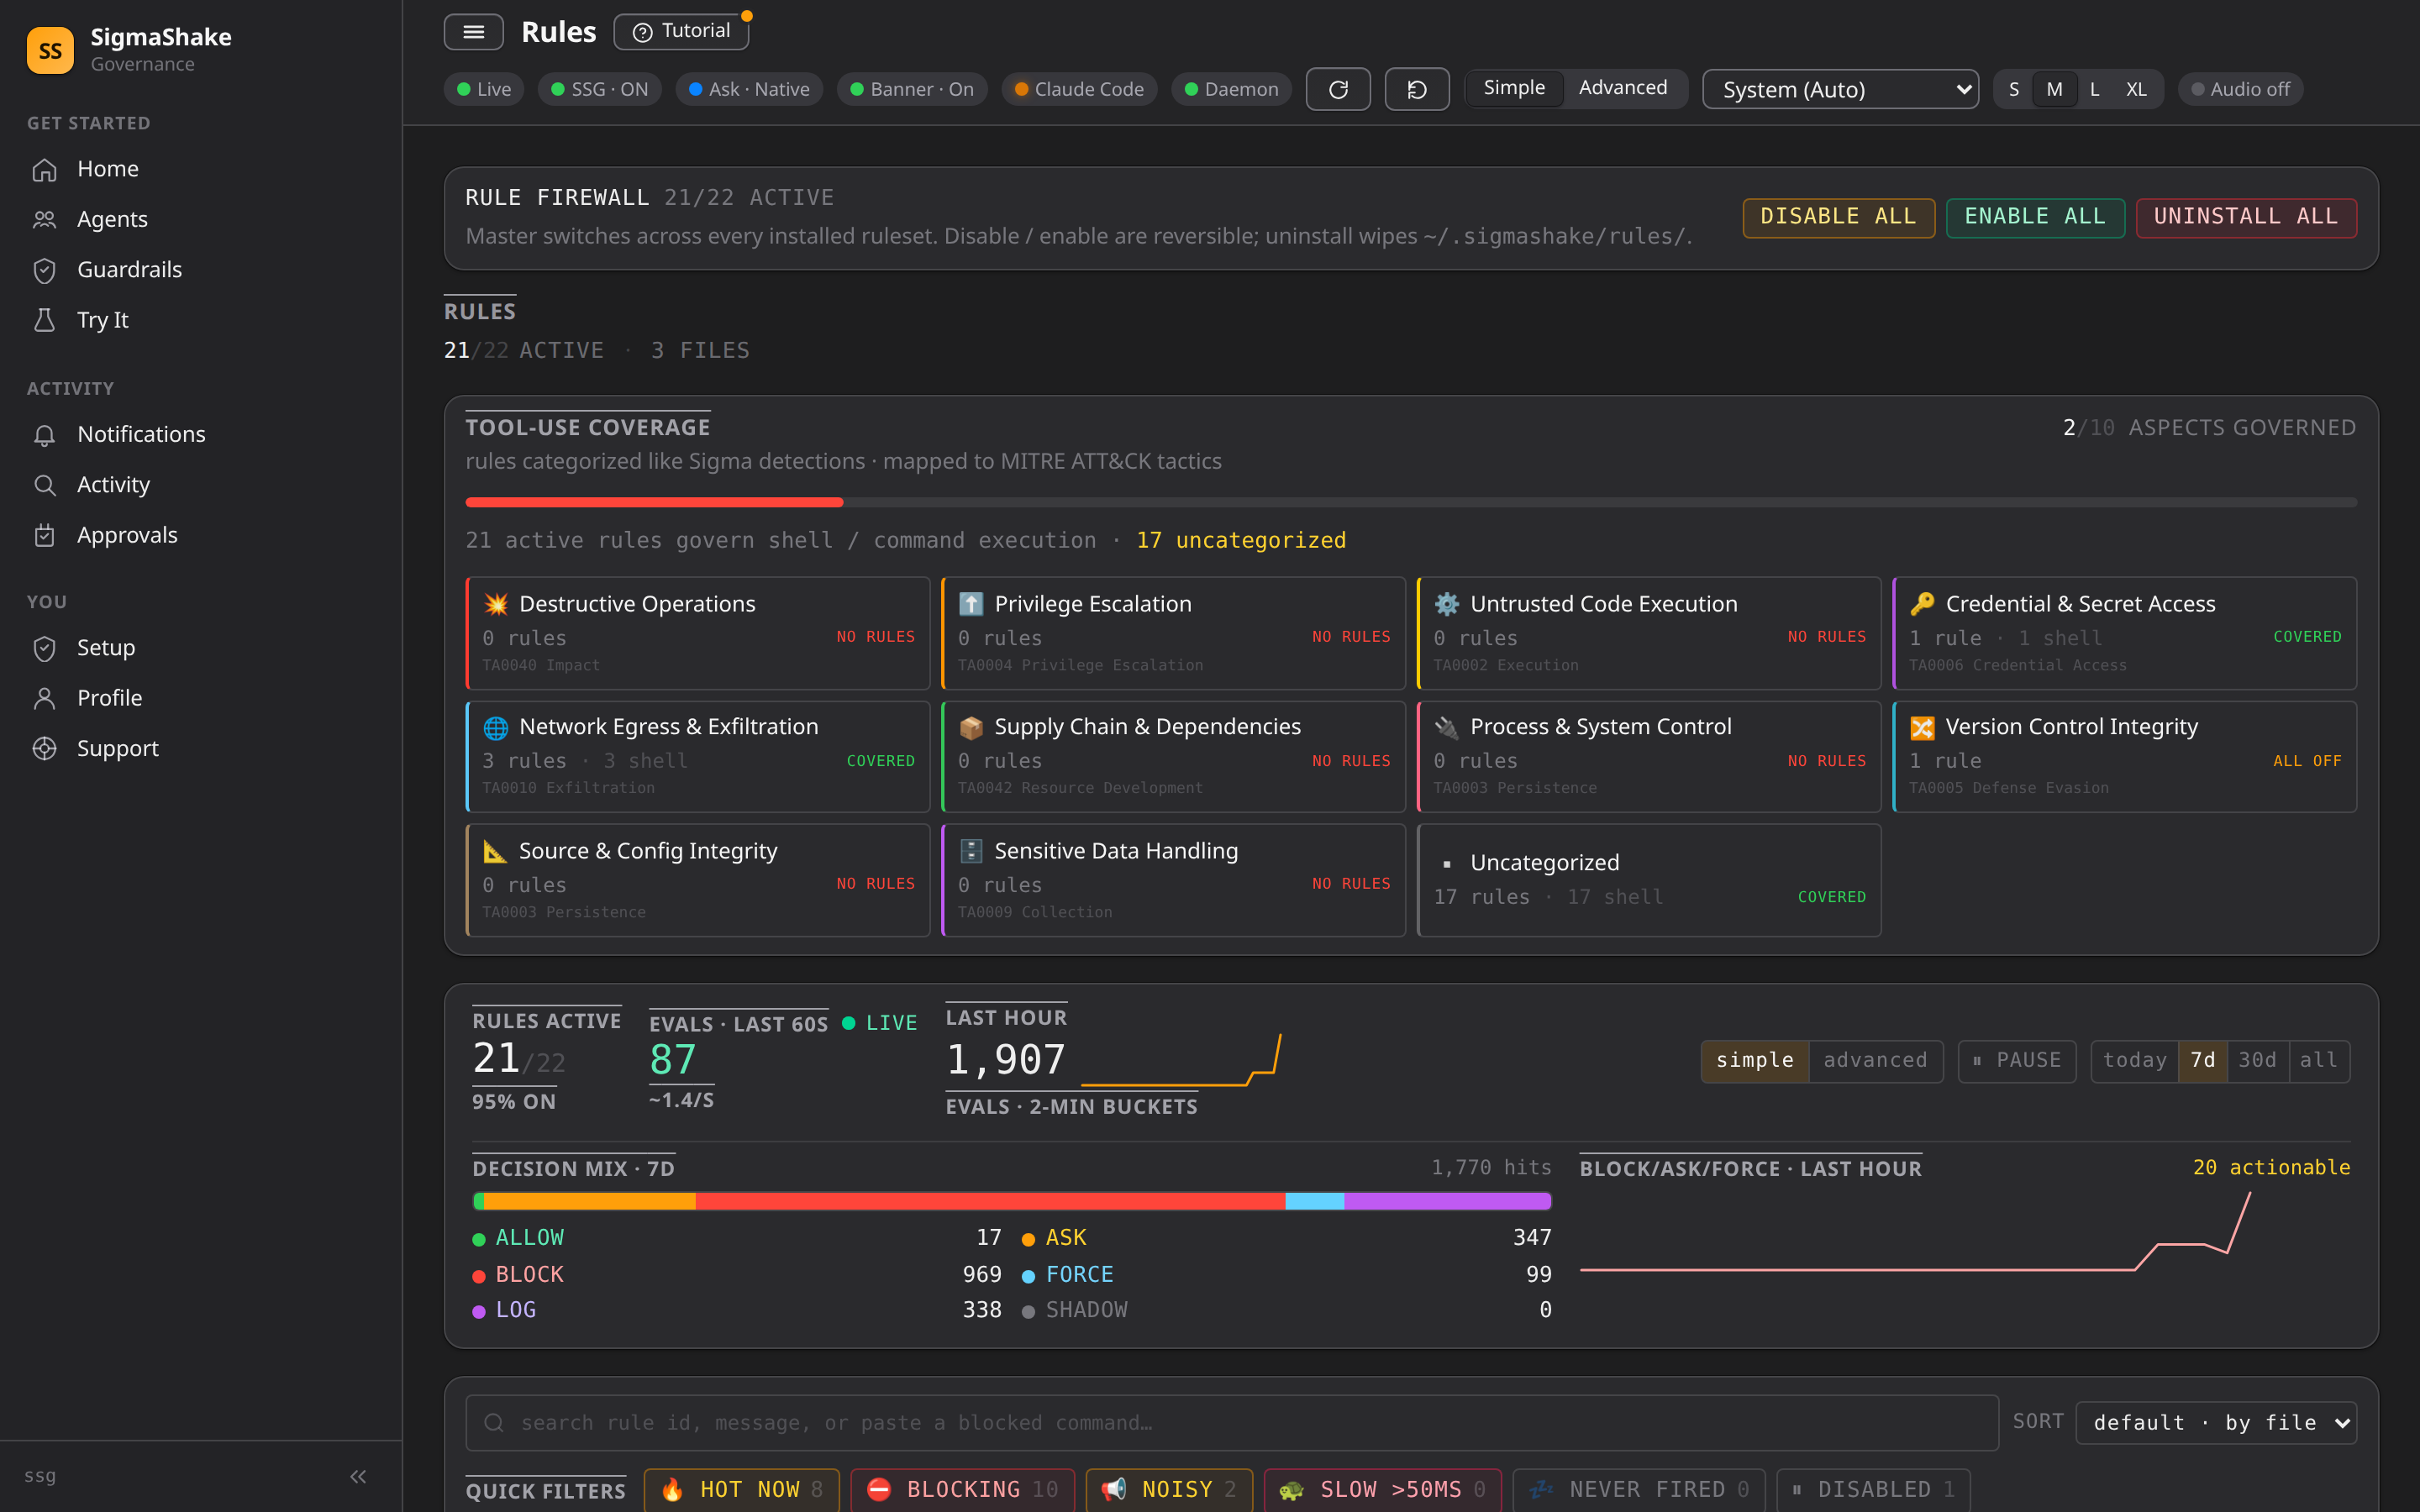
Rules (/rules)
Browse and inspect all loaded governance rules:
- Rule ID, priority, severity, decision, target
- Condition details
- Enabled/disabled status
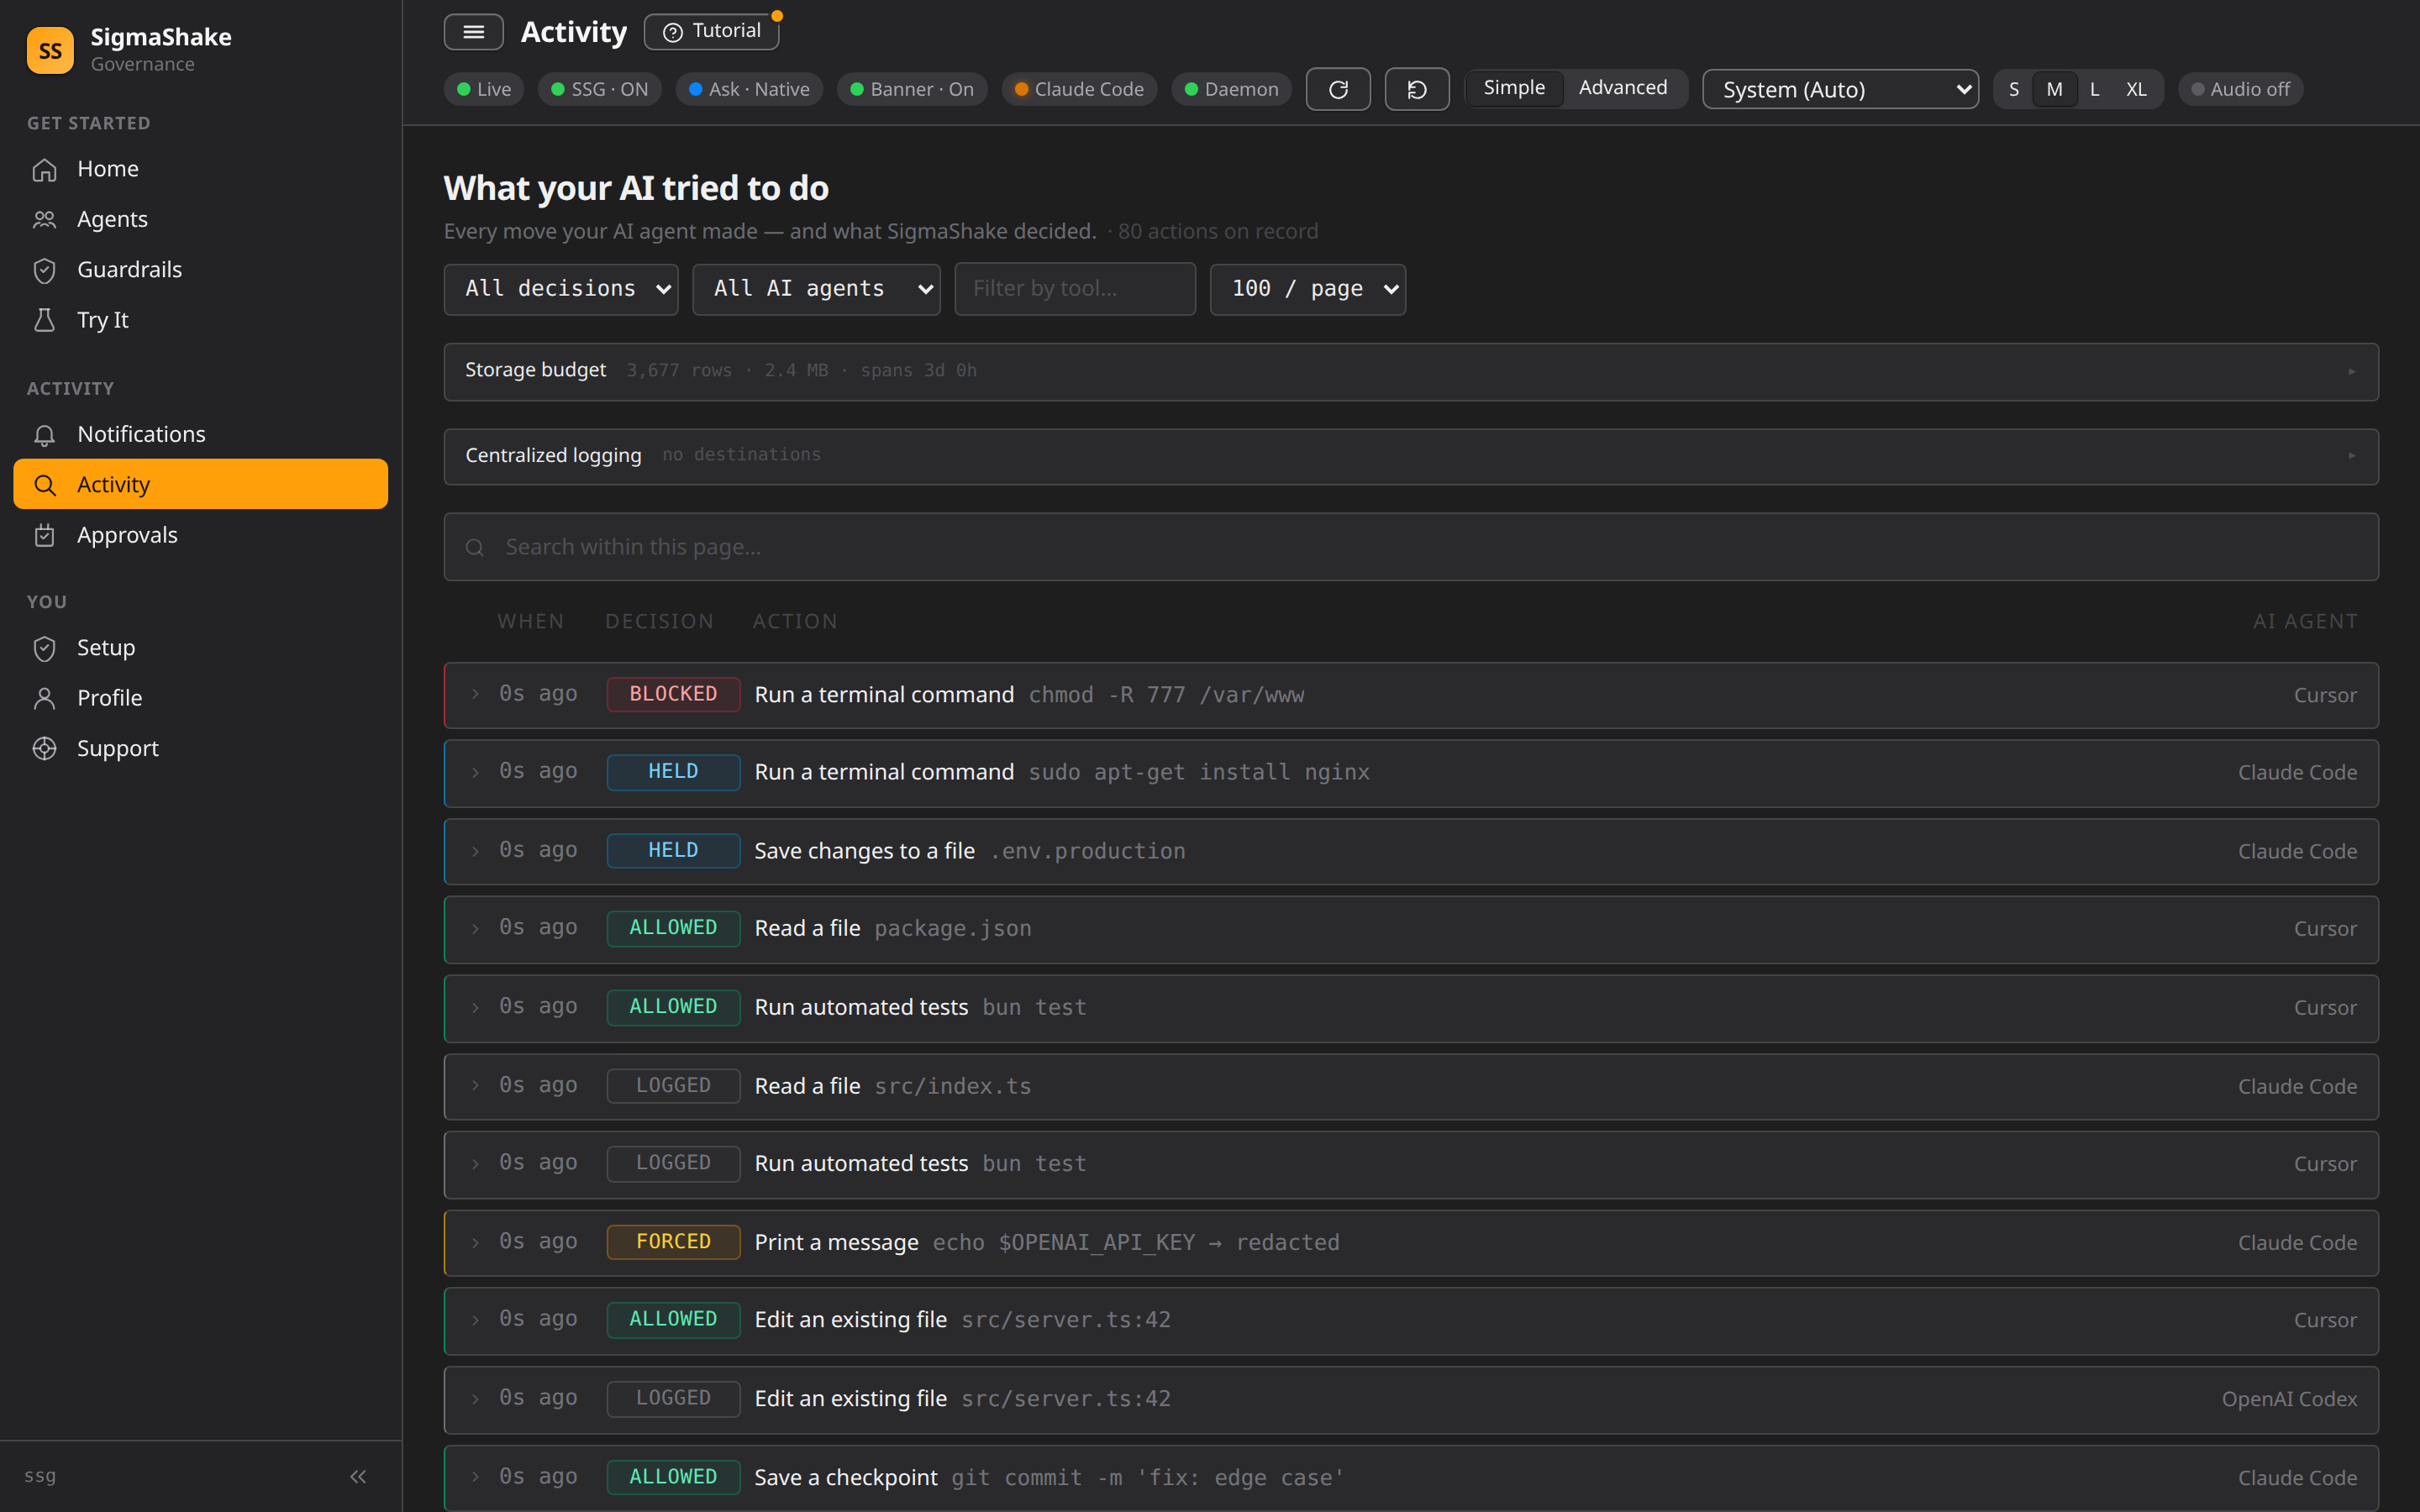
Audit (/audit)
Full audit log with filtering:
- Filter by decision type (allow, block, log, shadow, ask, force)
- Filter by tool name
- Search within audit entries
- Agent subagent_type shown as inline badges
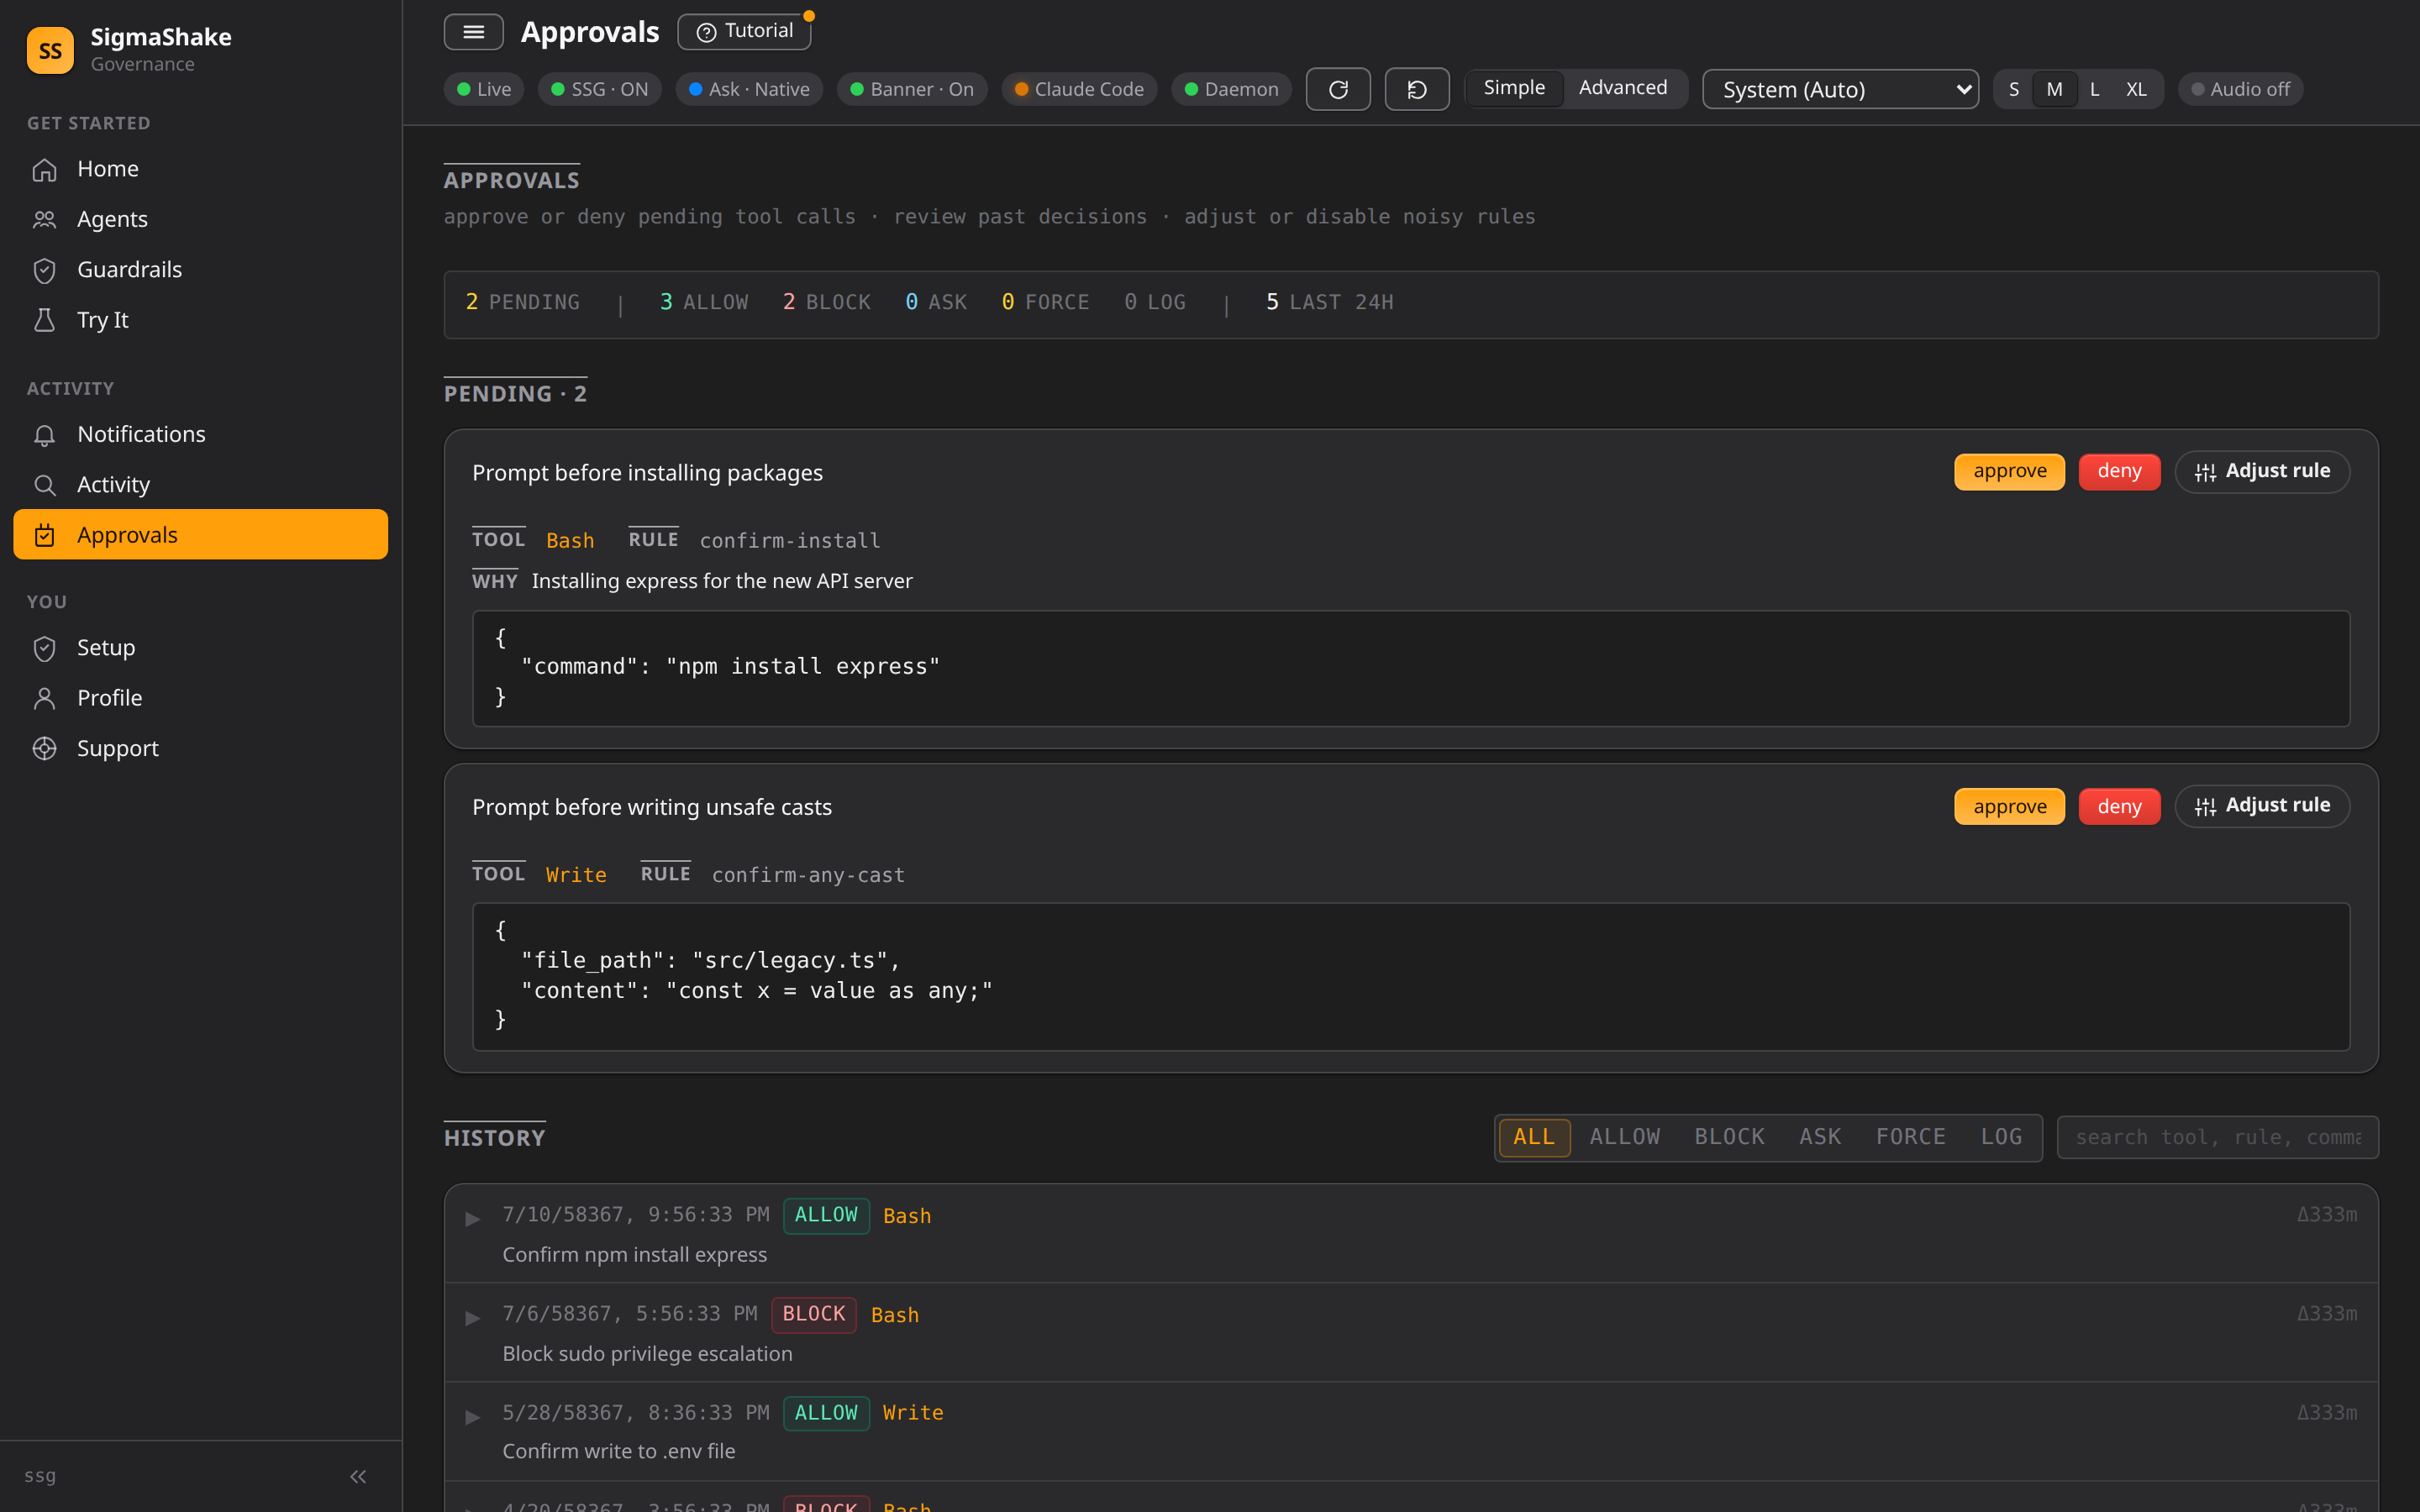
Approvals (/approvals)
The human-in-the-loop queue for ASK decisions — tool calls pause here until you approve or deny:
- Pending cards — each shows the tool, the matched rule, and the exact input (command, or file + content)
- Approve / Deny / Adjust rule — decide inline, or jump straight to tuning the rule that fired
- History — past decisions, filterable by allow / block / ask / force / log / shadow
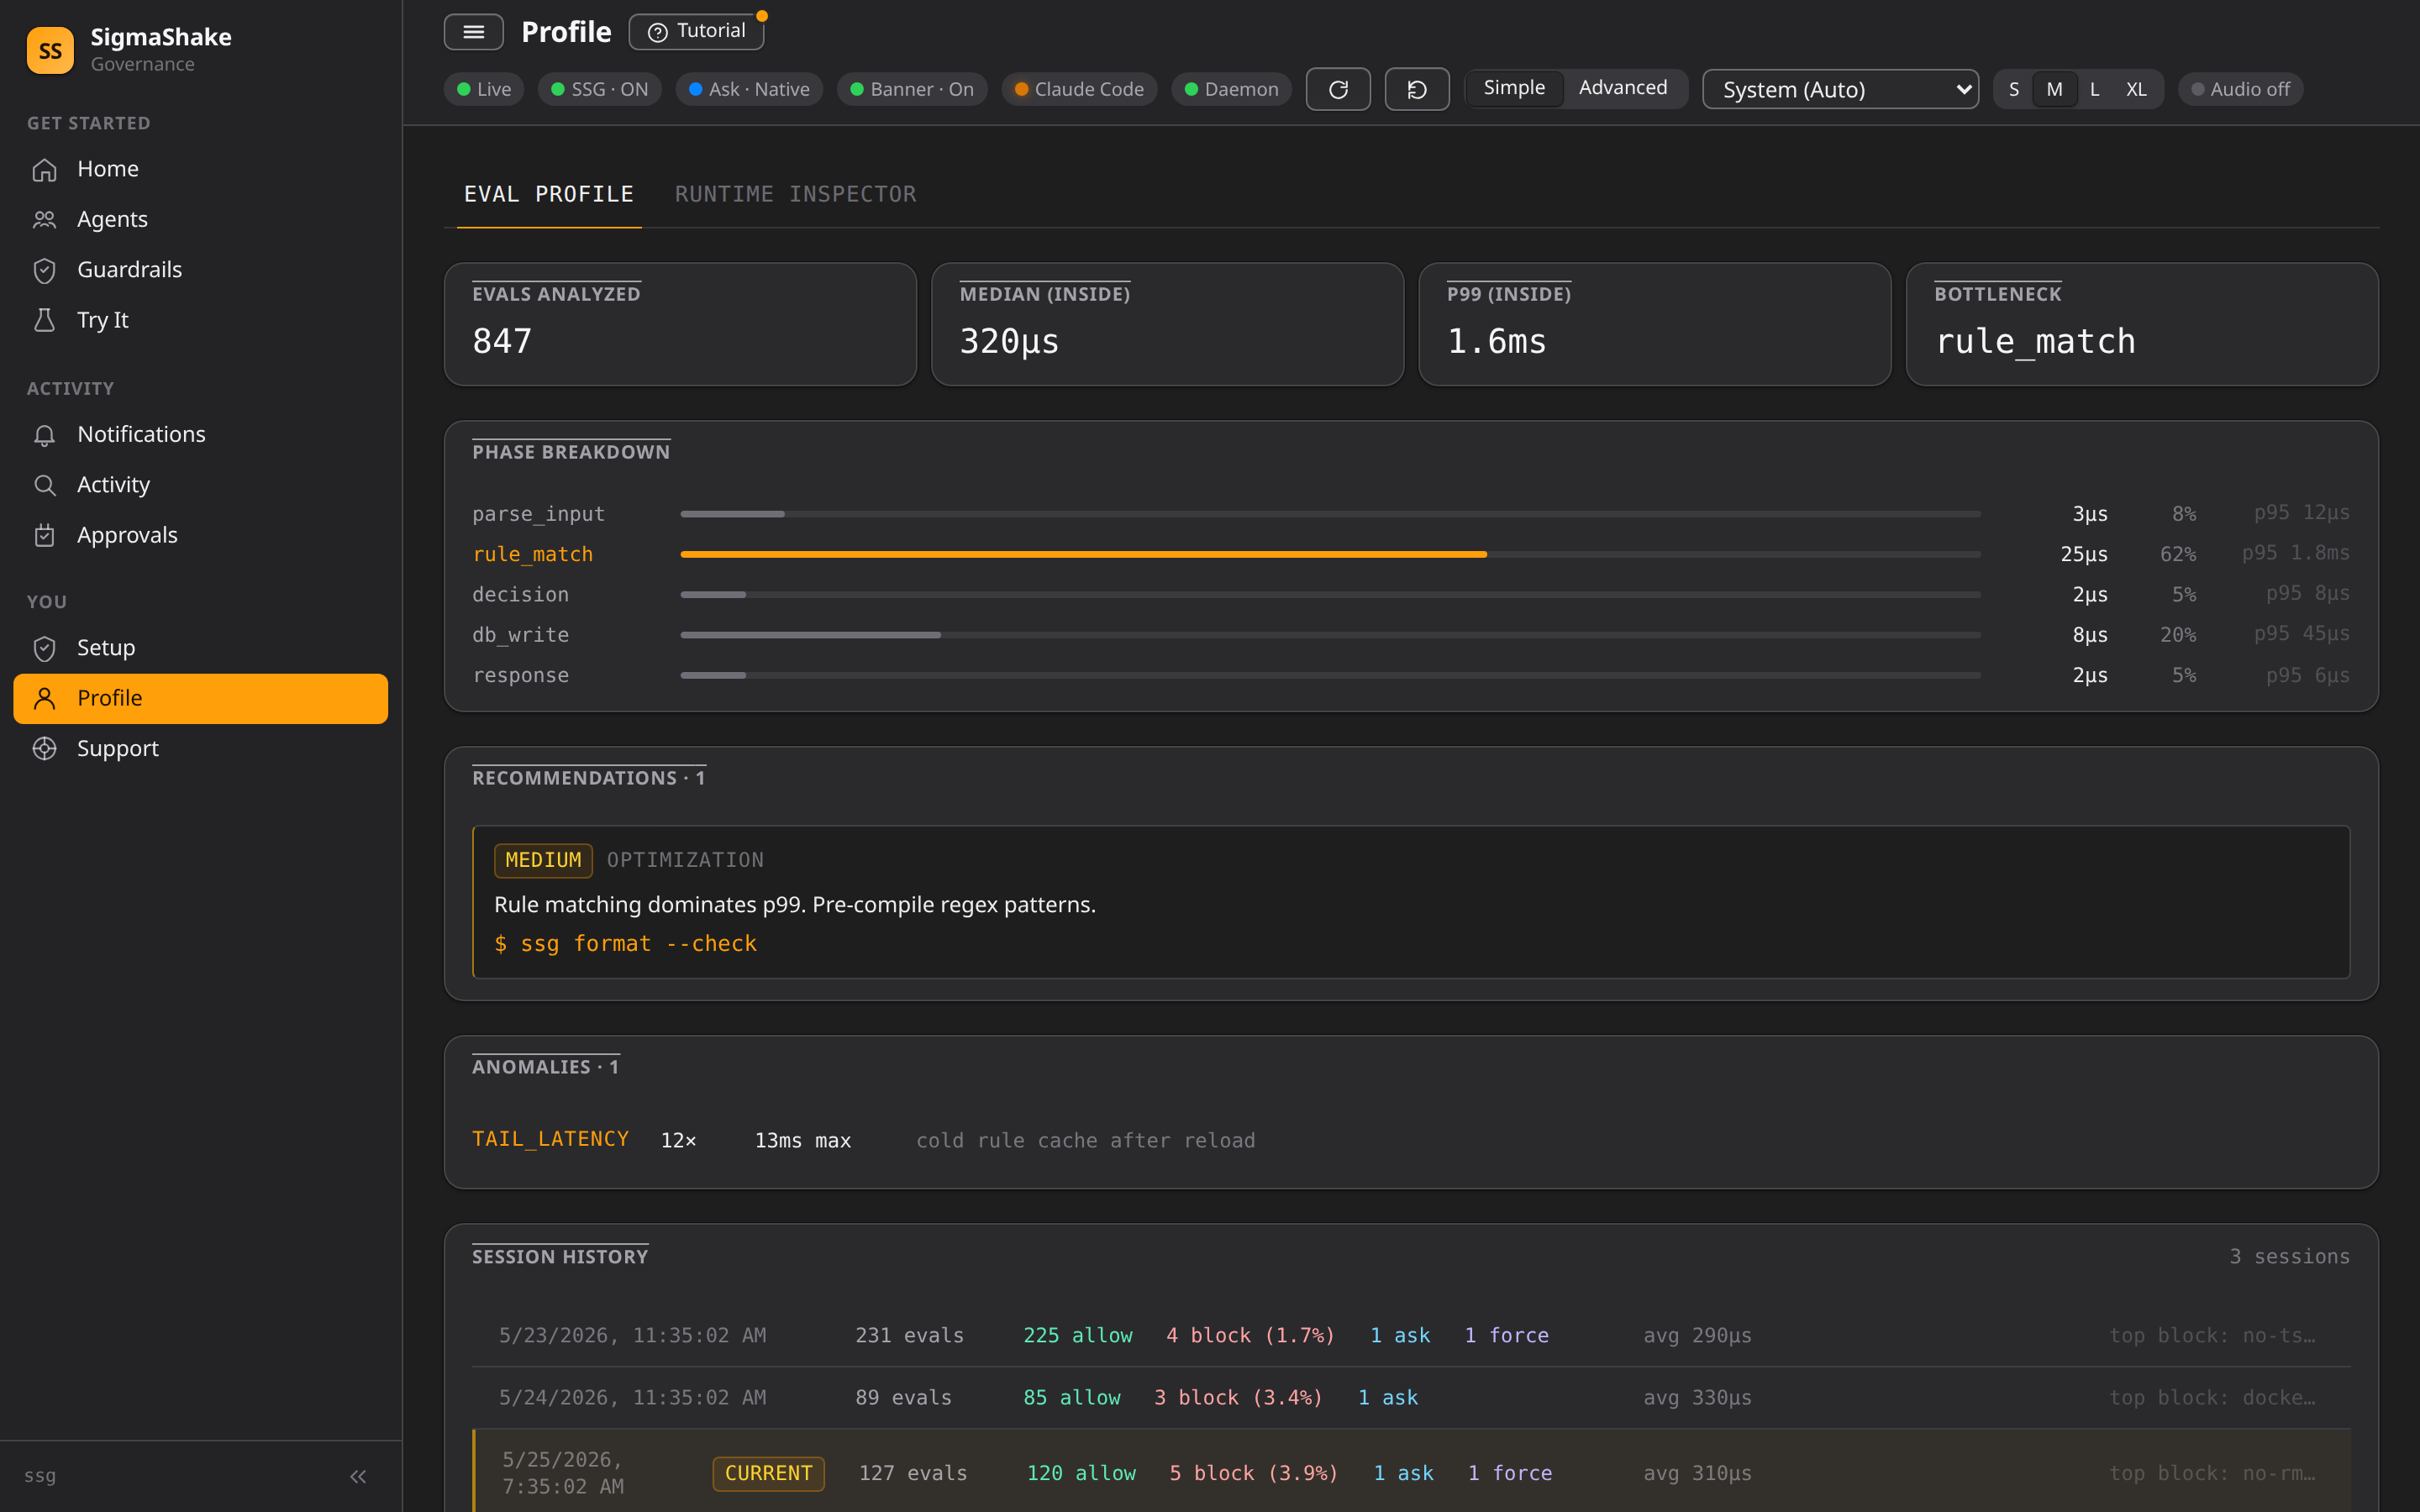
Profile (/profile)
Evaluation performance profiling:
- Latency distribution
- Slowest rules
- Cache hit rates
Debug (/debug)
AI-native realtime debugger — see why a tool call was blocked, whether a new rule actually fired, and where eval latency is going. Five tabs (RCA, Timeline, Watch, State, Metrics) all backed by the same ssg:// URI resolver that powers the ssg debug CLI and ssg_debug_* MCP tools.
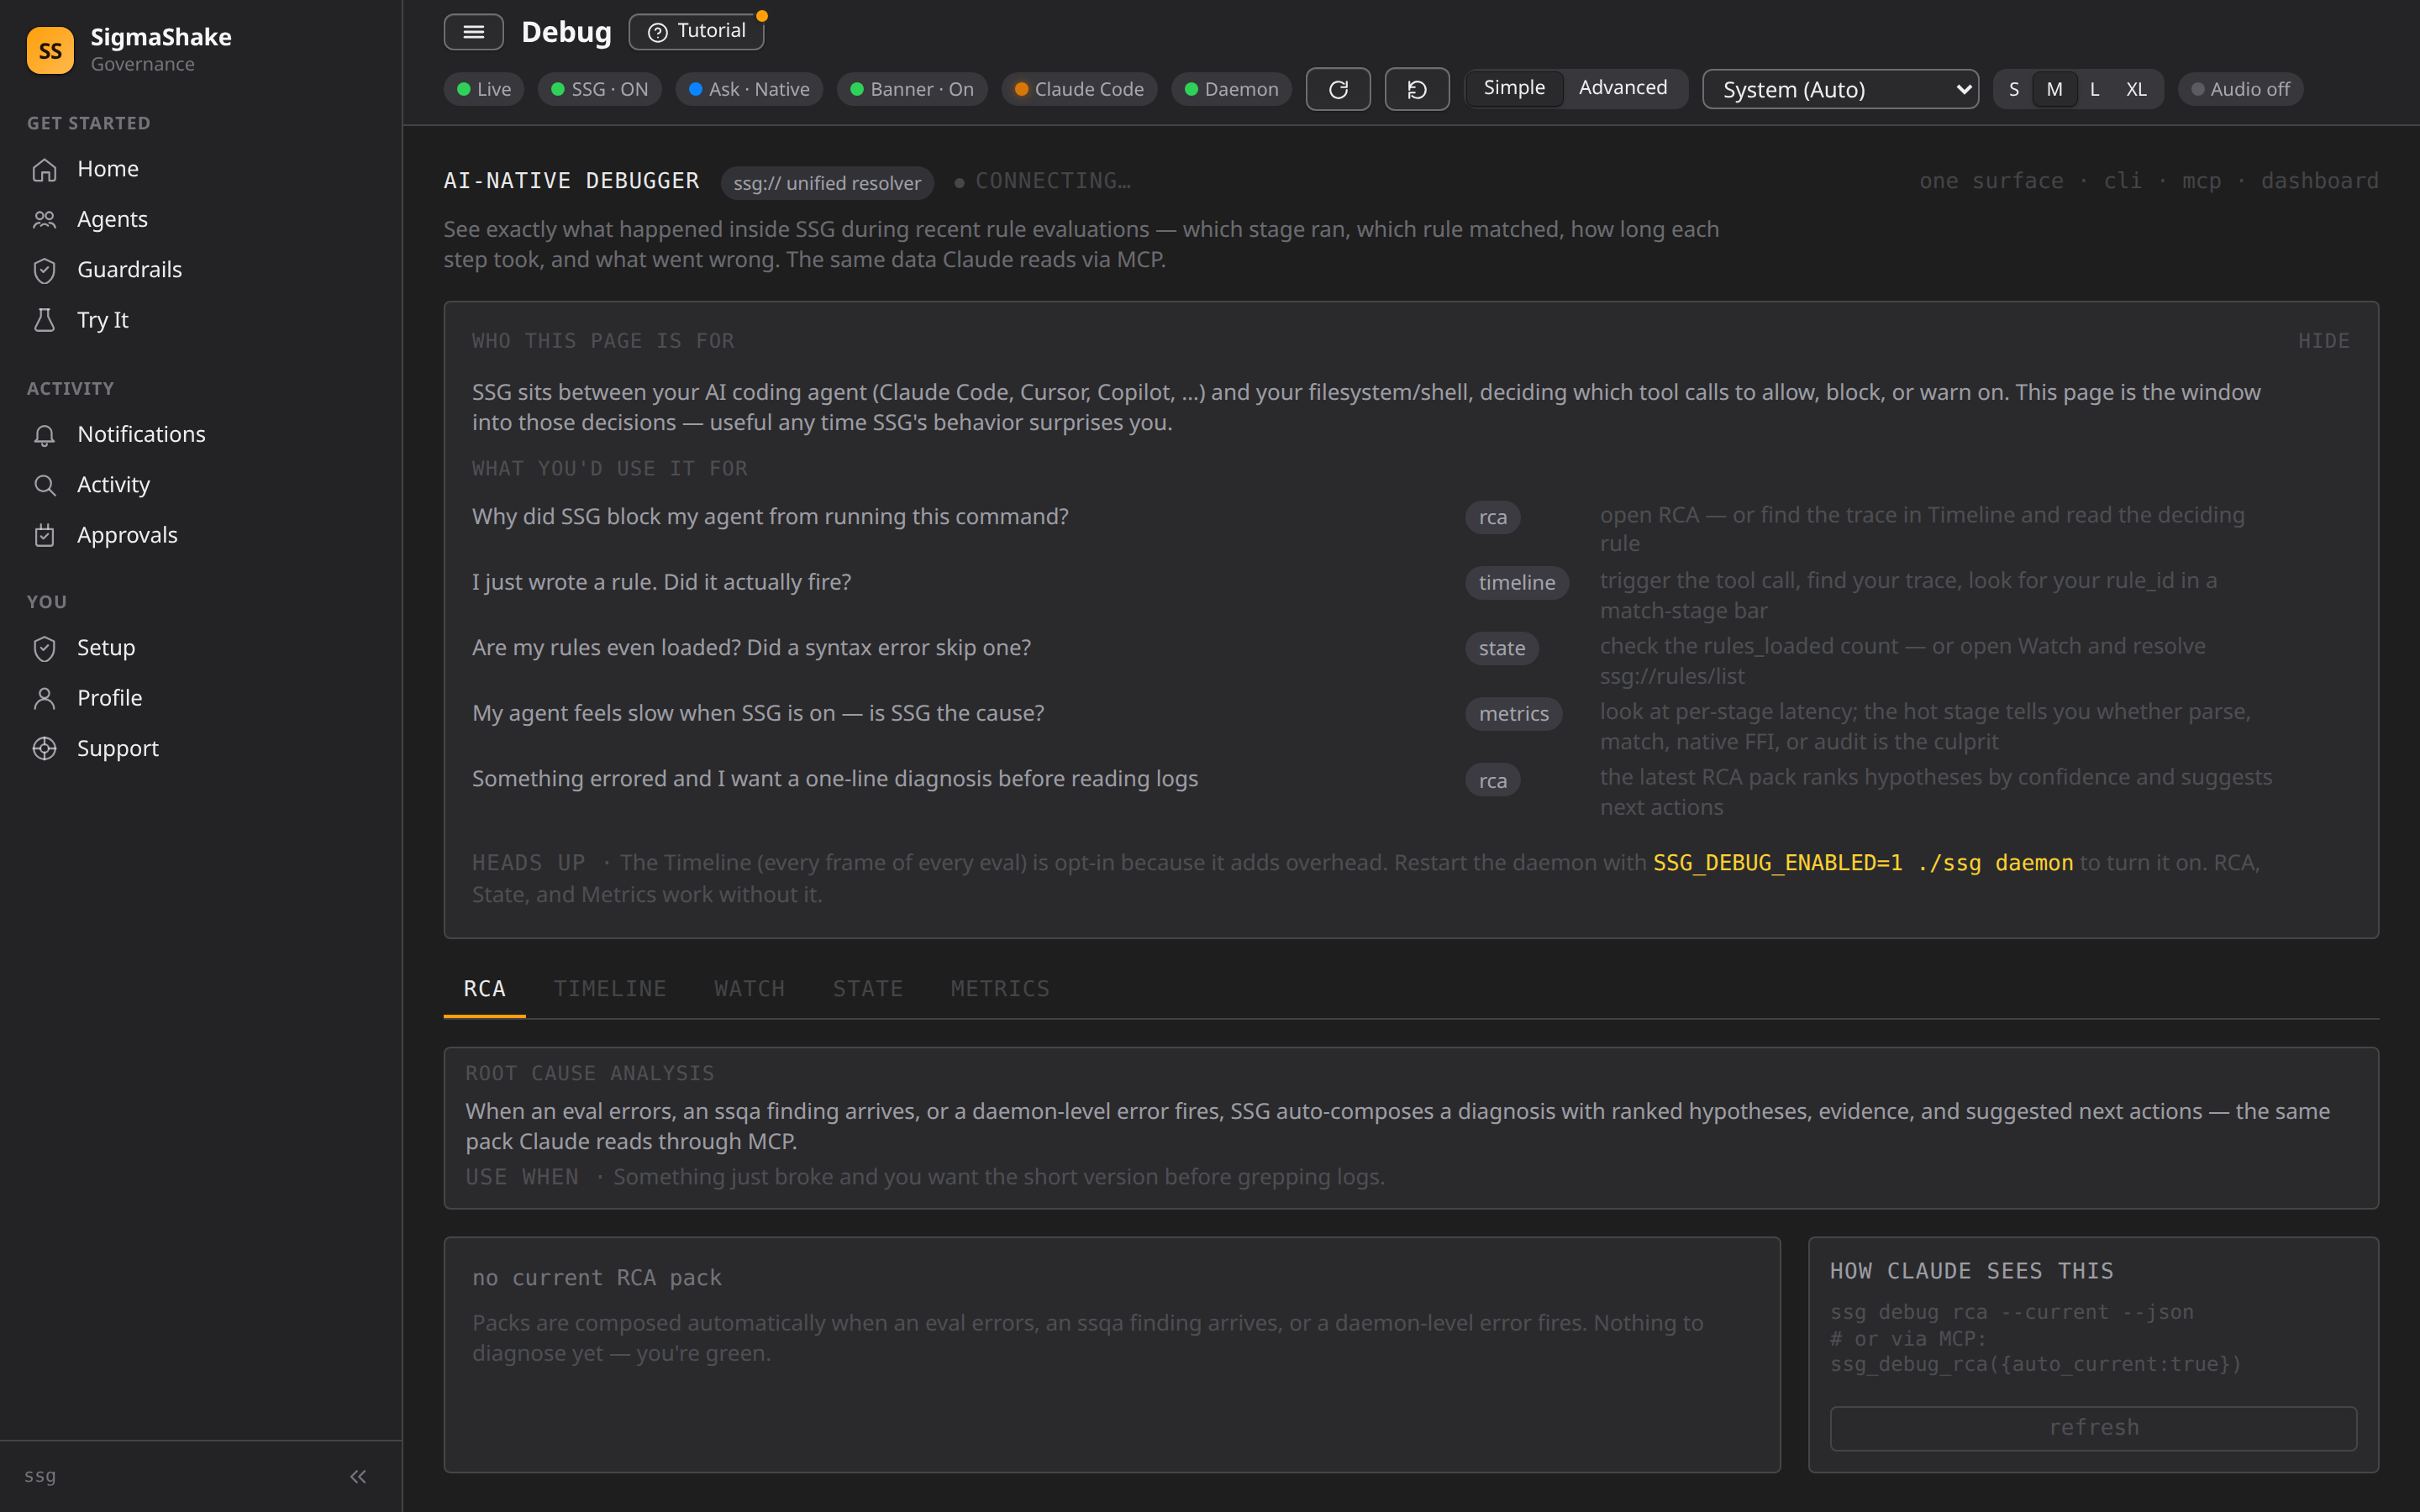
The Timeline (per-stage eval frame visualization) requires SSG_DEBUG_ENABLED=1 on the daemon; everything else works out of the box.
See the dedicated Debug Page guide for tab-by-tab walkthrough, env-var setup, and CLI/MCP equivalents.
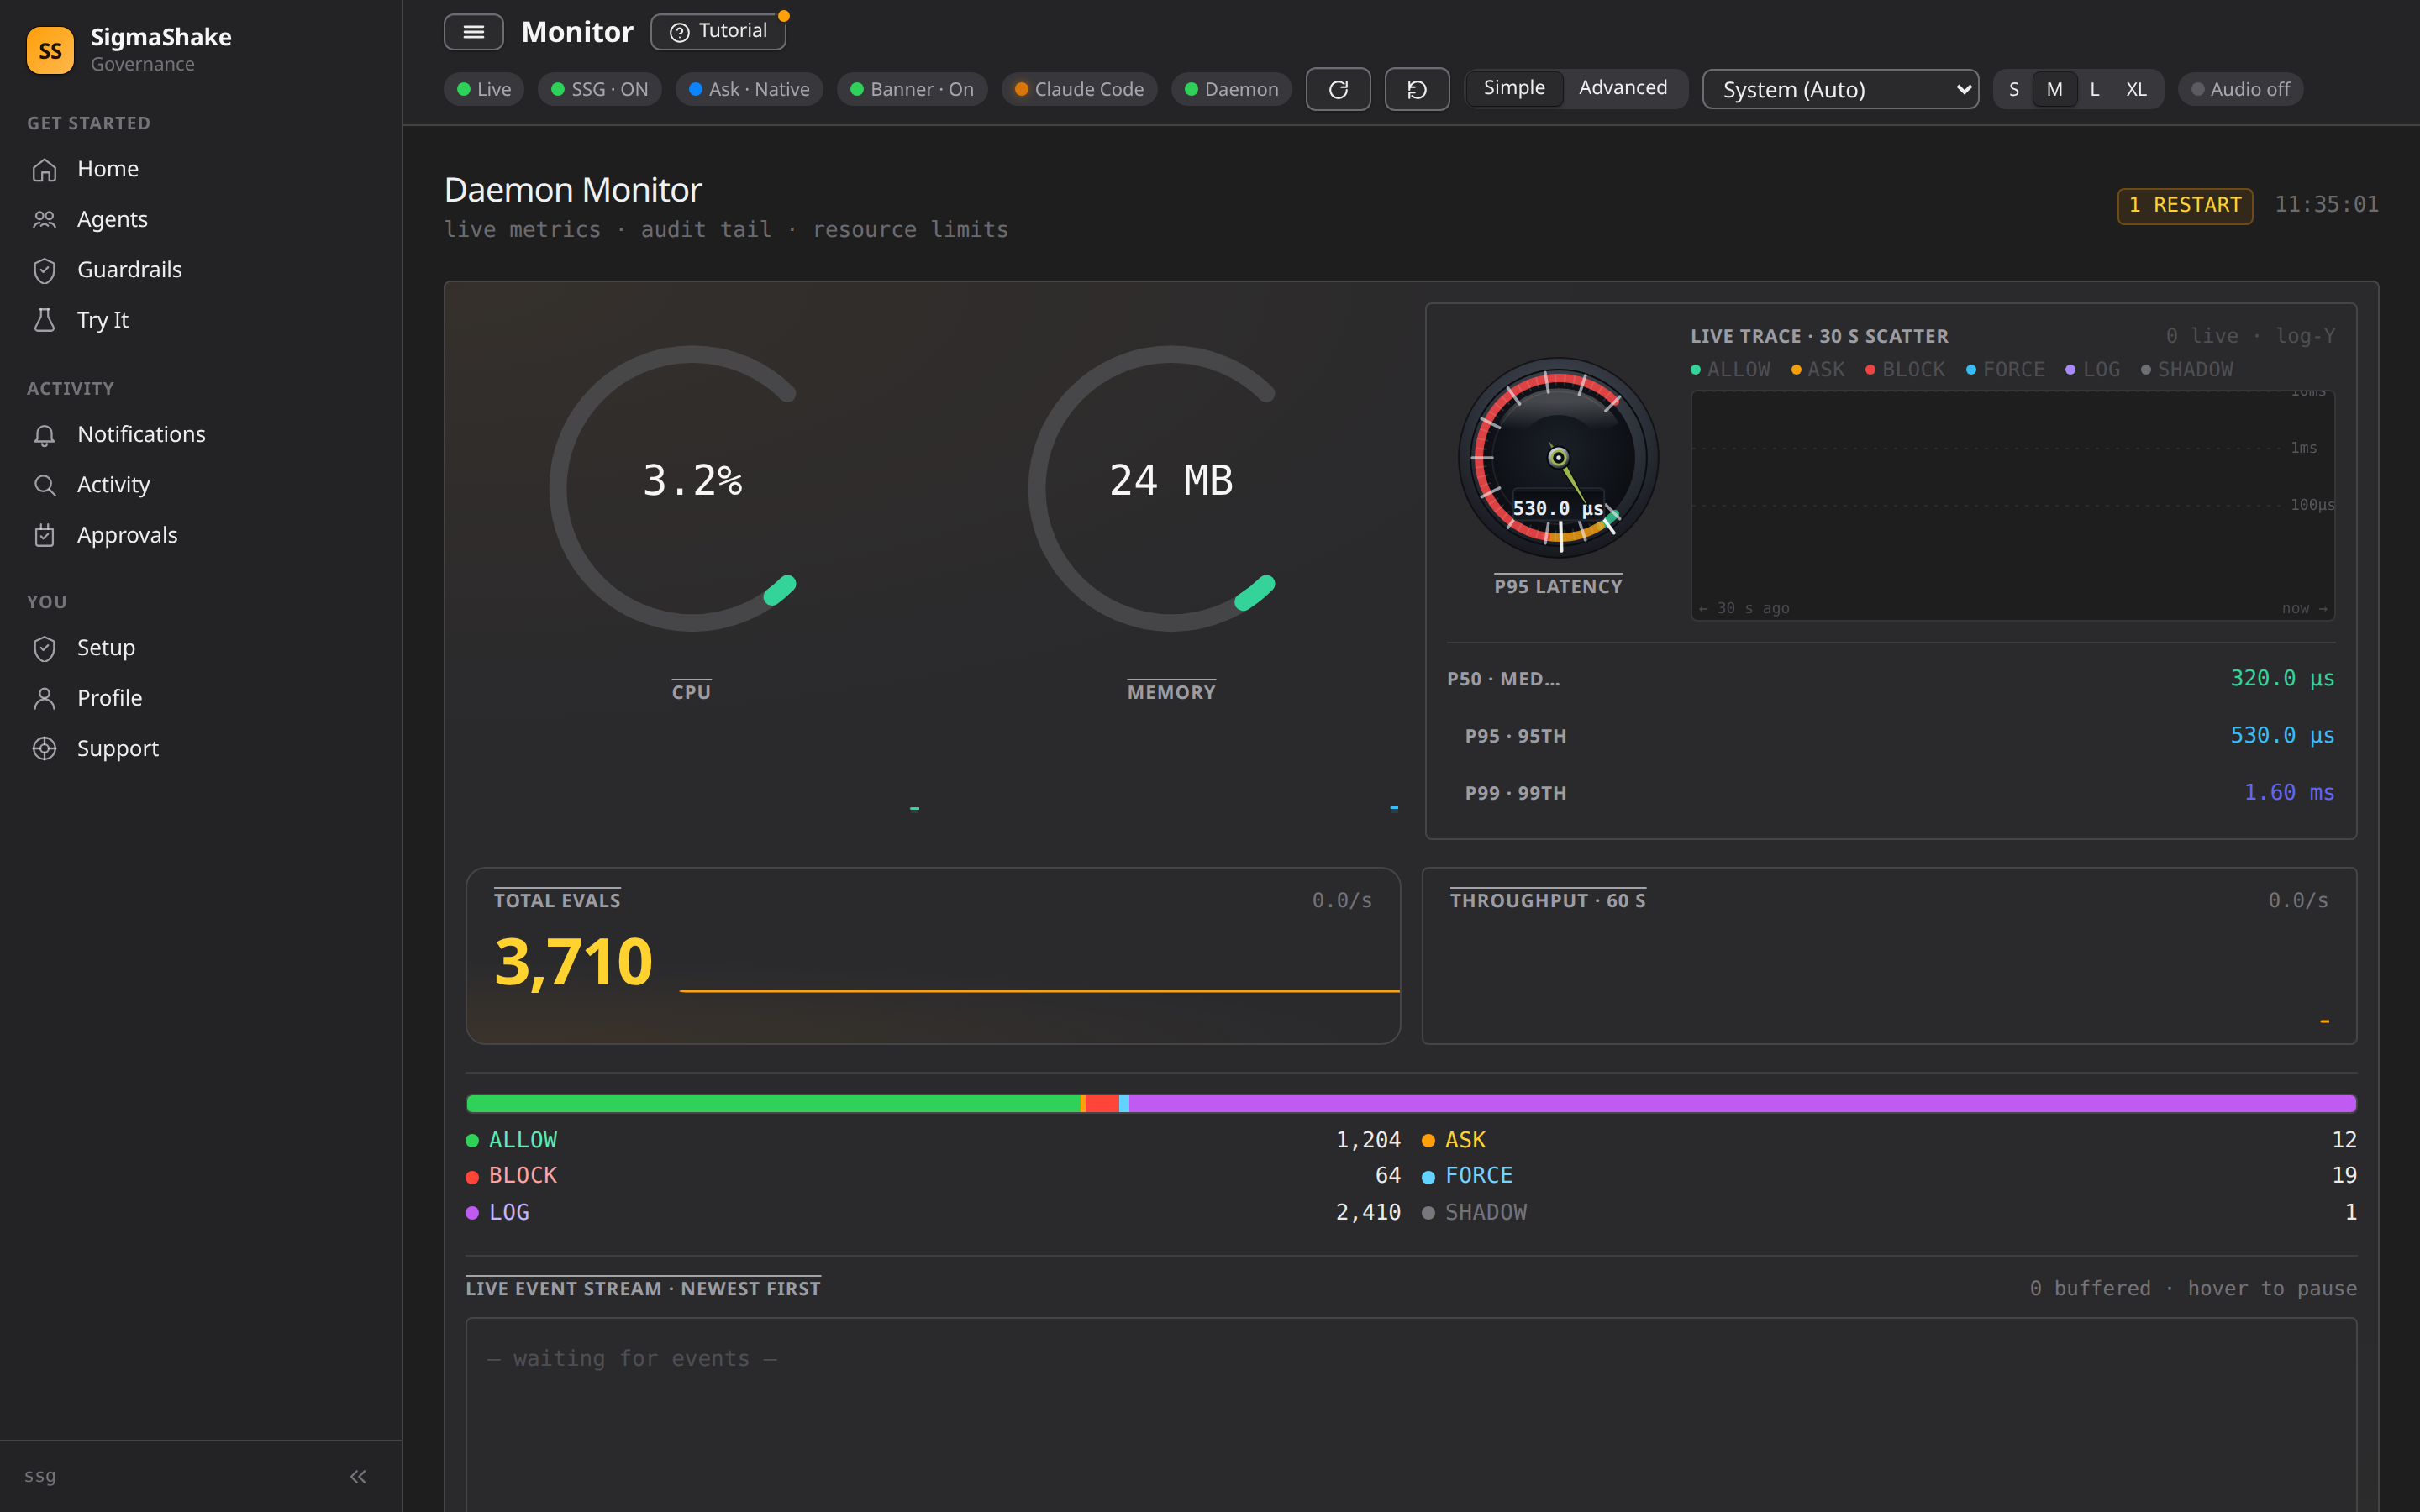
Monitor (/monitor)
Live daemon health and throughput at a glance:
- CPU / memory gauges and P50 / P95 / P99 eval-latency readouts
- Total evals and per-second throughput, with the live decision mix
- Live event stream — eval decisions as they happen
React SPA Architecture
The dashboard is built as a highly responsive React Single Page Application (SPA).
- Client-Side Rendering — UI interactions and state are managed entirely within the browser payload.
- REST JSON API — Data is fetched from the SigmaShake engine via JSON API endpoints rather than HTML fragments.
- SSE Streams — Real-time synchronization of approvals and audit logs is maintained dynamically via
EventSource.
API endpoints (JSON)
| Method | Path | Purpose |
|---|---|---|
| GET | /api/health | Health check |
| GET | /api/audit | Audit log data |
| GET | /api/blocked | Blocked commands |
| GET | /api/stats | Decision statistics |
| GET | /api/metrics | Performance metrics |
| GET | /api/events | SSE event stream |
| POST | /api/pending | Create approval request |
| GET | /api/pending/:id/status | Check approval status |
| POST | /api/decide/:id | Approve/deny a pending request |
| GET | /api/json/workflows | List workflows + recent runs |
| GET | /api/json/workflows/:id | Fetch single workflow run detail |
Fleet Dashboard (Enterprise)
The Fleet dashboard is a cloud-hosted control plane available at https://{your-org}.fleet.sigmashake.com. It provides centralized management for enterprise organizations.
Accessing the Fleet Dashboard
Navigate to your org's Fleet URL:
https://sigmashake.fleet.sigmashake.com
Authentication is required via SSO (Okta, Azure AD, etc.) or session cookie. See Fleet SSO Setup for configuration.
Fleet Dashboard Pages
| Page | Path | Description |
|---|---|---|
| Agents | /agents | View and manage enrolled machines, their status, last check-in, and policy versions |
| Policies | /policies | Create and manage fleet-wide governance policy bundles |
| Enrollment | /enrollment | Generate enrollment codes for onboarding new machines |
| Health | /health | Org-wide agent health overview with connectivity status |
| Audit | /audit | Centralized audit log across all fleet agents |
| Hub Catalog | /hub-catalog | Browse and deploy Hub rulesets to your fleet |
| Settings | /settings | Organization settings, SSO configuration, and member management |
Fleet CLI Commands
# Enroll a machine into your fleet org
ssg fleet enroll --code=<enrollment-code>

# Check enrollment and policy status
ssg fleet status

# Remove fleet enrollment
ssg fleet unenroll
See CLI Reference for full fleet command documentation.