Debug Page
The Debug Page is SSG's window into its own decision-making. Every time SSG checks a tool call (Bash, Read, Edit, Write, …), it runs a small pipeline:
parse → match → decide → audit
This page lets you watch that pipeline live so you can answer questions about SSG's behavior — most often: "Why did SSG block (or allow) this?" and "Is my new rule actually firing?".
The same data is also exposed via the ssg debug CLI and the ssg_debug_* MCP tools, so Claude Code, Cursor, and other clients see exactly what you see in the dashboard.
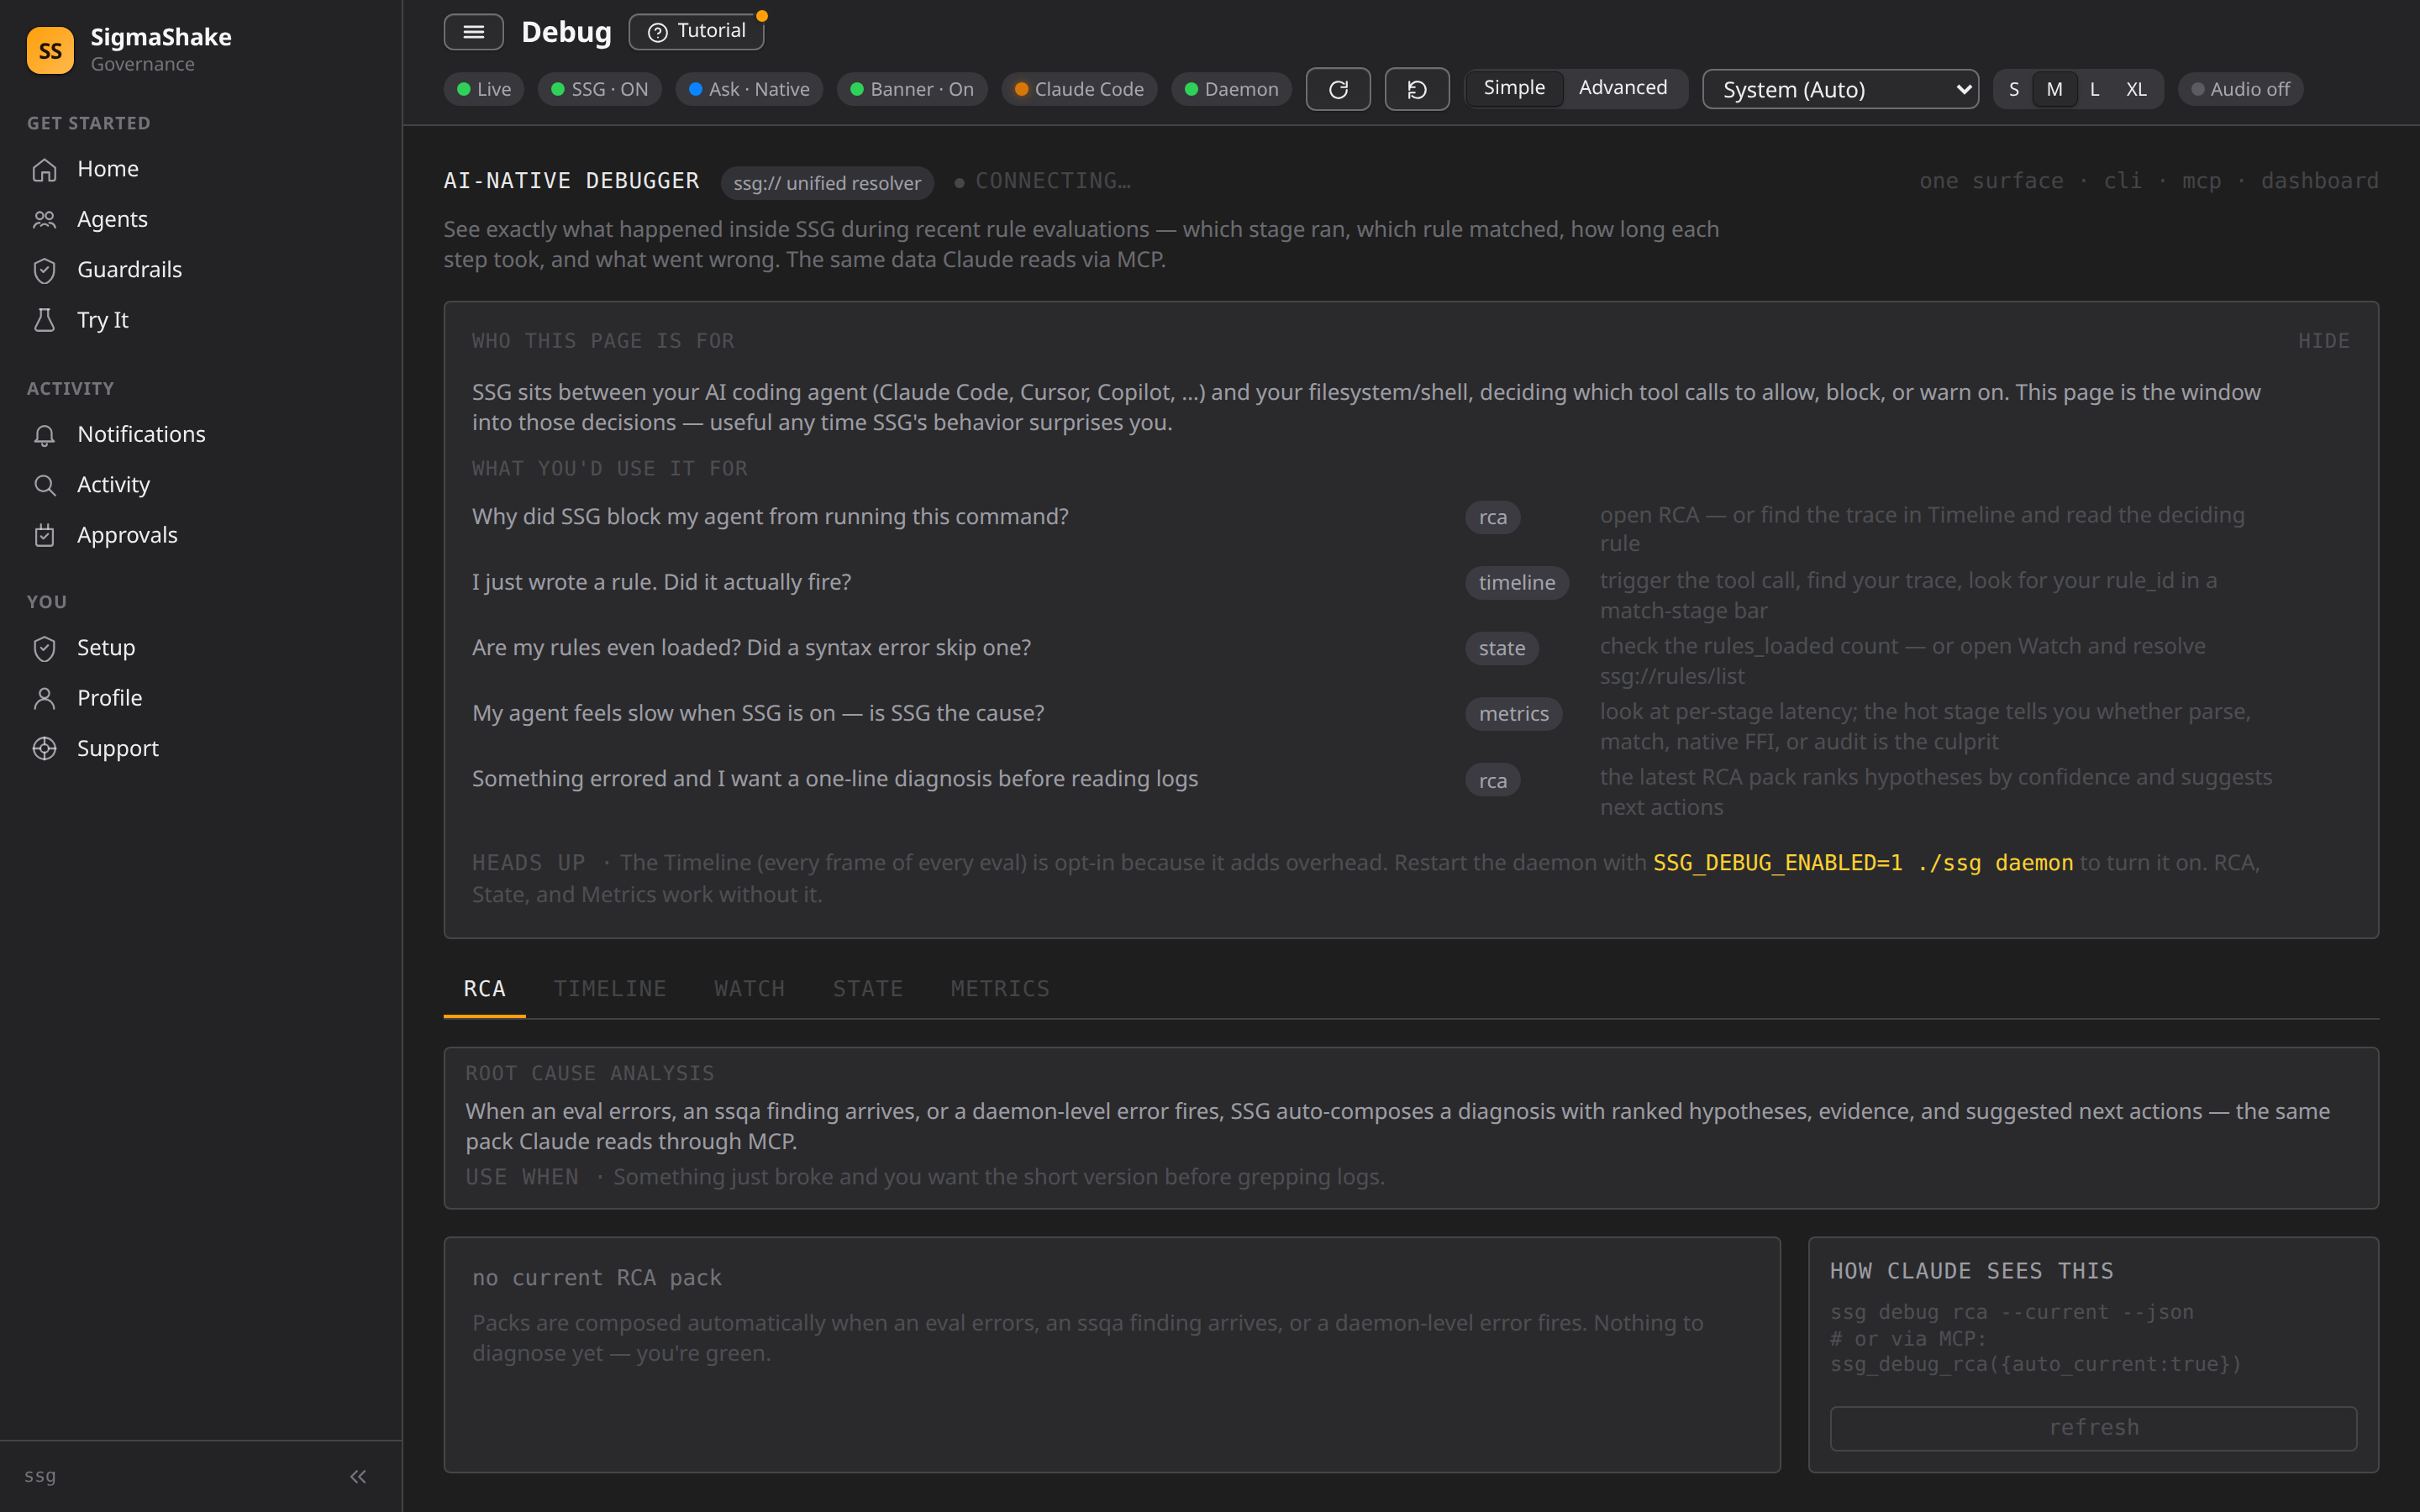
Who this is for
You don't need to be developing on SSG itself to get value from this page. Common audiences:
| You are… | …and you'd use this page to… |
|---|---|
| A rule author | Confirm your new .rules file is loaded and that your rule actually matched the tool call you wrote it for |
| A team admin | Understand why your AI agent got blocked from running a command in front of a teammate |
| An operator | Troubleshoot the daemon when evals feel slow, drop events, or behave unexpectedly |
| An SSG developer | Trace per-stage timings, inspect native FFI calls, and replay frames for a specific trace |
Opening the page
ssg serve # starts daemon + dashboard on http://localhost:5599
Then navigate to http://localhost:5599/debug.
Enabling frame capture
Most tabs work out of the box. The Timeline tab — which renders a flame-chart of every eval frame — is opt-in because collecting every frame adds overhead on the hot path. To turn it on, restart the daemon with the env var set:
SSG_DEBUG_ENABLED=1 ssg daemon
You can confirm capture is on at a glance: the top-right of the page shows a green pulsing LIVE chip when frames are being captured, or an amber DEBUG OFF chip when they aren't. When debug is off, an explicit banner above the tabs tells you the Timeline will stay empty until you restart with the env var.
SSG_DEBUG_ENABLED is read once at daemon startup, so changes only take effect on restart. There is no runtime toggle by design — disabled means a single return null on the hot path, with zero allocations.
The five tabs
The page has five tabs. They all read from the same unified ssg:// URI resolver inside the daemon, so they're always consistent with the CLI and MCP equivalents.
RCA — Root Cause Analysis
Use when: Something just broke and you want a one-line diagnosis before grepping logs.
When an eval errors, an ssqa finding fires, or a daemon-level error occurs, SSG auto-composes an RCA pack with:
- A short summary of what went wrong
- Severity (critical / high / medium / low)
- Ranked hypothesis list with confidence percentages and evidence bullets
- Suggested next actions
- Links to related
ssg://resources for drill-down
The CLI equivalent is ssg debug rca --current, and the MCP equivalent is ssg_debug_rca({auto_current: true}). Claude Code's /rca slash command and the /prelude skill pull from this same pack.
Timeline — Eval Frame Visualization
Use when: You want to see exactly which stages a rule went through and how long each took.
A flame-chart of the last 1024 eval frames across every rule and tool call:
- Rows group frames by
trace_id— one tool call = one trace - Bar colors identify the pipeline stage (hook-ingress, parse, match, ffi-call, decide, audit, respond)
- Bar width is the stage's duration in nanoseconds
- A red outline means that stage errored
Click any bar to open the frame inspector sidebar with full detail: stage, tool, duration, rule_id, error type/message, sanitized input preview, full trace and frame IDs.
Requires SSG_DEBUG_ENABLED=1 on the daemon. Frames are also persisted to SQLite for 24 hours so you can investigate evals that happened earlier in the day.
Watch — Live URI Subscription
Use when: You know which internal resource you want to inspect and want to watch it update in real time.
Subscribe to any ssg:// URI and the pane re-fetches whenever the daemon emits a relevant SSE event. Quick-select buttons cover the common cases; the text input accepts any URI the resolver supports.
Available URIs:
| URI | Returns |
|---|---|
ssg://daemon/state | Live vitals (uptime, rules loaded, native FFI availability, frame ring, eval quotas) |
ssg://daemon/metrics | Latency distributions and event counters |
ssg://audit/recent?limit=20 | Recent audit rows |
ssg://audit/<id> | A single audit row |
ssg://frames/recent?limit=64 | Newest debug frames |
ssg://frames/<trace_id> | All frames for one eval (supplemented from SQLite if the ring buffer is short) |
ssg://frames/<trace_id>/<frame_id> | A single frame |
ssg://rules/list | All loaded rules |
ssg://rules/<rule_id> | A single rule |
ssg://rca/current | The latest RCA pack |
ssg://rca/trace/<id> | RCA pack for a specific trace |
ssg://native/stats | Native FFI evaluator stats |
State — Daemon Snapshot
Use when: The daemon feels off and you want to confirm it's healthy.
Renders ssg://daemon/state. Key fields:
uptime_ms— how long the daemon has been runningrules_loaded— number of rules currently loaded (use this to confirm a new.rulesfile was picked up)native_available— whether the native FFI evaluator was loadedaudit_worker_ready— whether the audit worker thread is accepting writesframe_ring_size,frame_ring_dropped— frame buffer statedaily_eval_count,eval_limit— current quota usagedebug_enabled— whetherSSG_DEBUG_ENABLED=1is set on the running daemon
Metrics — Performance Counters
Use when: Evals feel slow and you want to find the hot stage before optimizing.
Renders ssg://daemon/metrics — latency distributions and counters for the eval pipeline. Look at per-stage timings to identify whether parse, match, the native FFI call, decide, or audit is the bottleneck.
CLI equivalents
Every dashboard view has a CLI mirror so you can script against the same data:
| CLI command | Purpose |
|---|---|
ssg debug snapshot <uri> | Fetch a single URI envelope as JSON |
ssg debug rca --current | Fetch the latest RCA pack (add --markdown for human-readable) |
ssg debug rca --trace=<id> | Fetch the RCA pack for a specific trace |
ssg debug watch <uri> | Long-poll a URI, print one envelope per change |
ssg debug follow | Stream new frames as JSONL (--tool, --trace, --rule filters) |
ssg debug analyze-sessions | Cost analysis of Claude Code conversation history (last 30 days) |
See ssg debug in the CLI reference for full flag documentation.
MCP equivalents
When the SSG MCP server is connected to your AI client, the same data is available as MCP tools:
| MCP tool | Maps to |
|---|---|
ssg_debug_snapshot | ssg debug snapshot |
ssg_debug_rca | ssg debug rca |
ssg_debug_watch | ssg debug watch |
ssg_debug_replay | replay frames for a specific trace |
This is how Claude Code's /rca and /prelude skills inject pre-computed root-cause analysis into a conversation without you having to fetch it manually.
Cost model
When SSG_DEBUG_ENABLED is unset, the entire frame-capture subsystem is a no-op. The check is a single environment-variable read at module init, so calls to emitFrame() short-circuit to return null with zero allocations on the hot path.
When enabled, frames are:
- Pushed to an in-memory ring buffer (1024 frames max)
- Queued for SQLite persistence in batches (24-hour retention, auto-pruned)
- Broadcast to dashboard subscribers via the
debug-frameSSE event
Input previews are sanitized for secrets before storage. The overhead is small but non-zero, which is why the flag exists at all.
Troubleshooting
"Live" chip is green but Timeline is empty. Confirm SSG_DEBUG_ENABLED=1 was set in the daemon's environment, not just your shell. Restart with SSG_DEBUG_ENABLED=1 ssg daemon and verify debug_enabled: true on the State tab.
Timeline shows frames but my rule_id isn't on any bar. Your rule may not be loaded — check rules_loaded on the State tab, or open Watch and resolve ssg://rules/list to confirm. If the rule is loaded but didn't match, the bars will still appear without a rule_id field on the matched-stage frame.
/debug page returns 404. You're hitting the daemon's Unix socket port or a different service. The dashboard runs on port 5599 by default (ssg serve).
RCA tab says "no current RCA pack". That's the green case — nothing has errored badly enough to compose a pack. Packs auto-fire on eval errors, ssqa findings, and daemon-level errors.